Originally published September 17, 2021 @ 7:32 pm
The Collatz conjecture is a math problem from the mid-1930s. It involves an algorithm that starts with any positive integer, and then each following number is made by taking the previous number and changing it. If the number n is even, you make it half of what it was (n/2). If the number is odd, you make it three times bigger and increment it by one (3n+1).
The algorithm leads to the 4-2-1 loop for any initial positive integer. Or so we think but can’t prove (or disprove). So far, all starting values up to 2^68 eventually ended up at 1, but this is almost nothing compared to the remaining infinity. There may be an integer greater than 2^68 that hasn’t been checked yet that will not end up at 1, thus disproving the conjecture.
Whatever the case may be, the apparent simplicity of this riddle has attracted many amateurs and professionals alike. Some of the world’s top mathematicians spent years and decades in fruitless attempts to find a solution. Obviously, I can’t help them, but I thought the Collatz conjecture would be a fun scripting exercise.
But first, why do these initial seed values shrink at all when looped through the Collatz algorithm? Even though there is the same number of odd and even numbers, whenever you triple an odd number and add one, it becomes even, and so (ignoring the ‘+1’ as insignificant) 3/2 is the most a number can grow in one step.
Half the time, splitting an even number gives you an odd number. But, if you take the geometric mean, to get from one odd number to the next odd number on the average, you multiply by 3/4, which is less than one. Statistically, this means the 3x+1 sequence is more likely to shrink.
The script below (GitHub link) revolves around this simple awk construct:
awk '{ if ($0 % 2) {exit 1} else {exit 0}}' <<<${n}
If n is even, the exit status will be 0, and the script will divide n by two:
n=$(bc <<<"${n}/2")
Otherwise, the script will multiply n by three and increment by one:
n=$(bc <<<"3*${n}+1")
This process will continue until n is equal to 1. Really very, very simple. But there is a small catch as far as Bash goes.
You may notice somewhere around line 28 that I am checking not the value of n but its length. The reason for this is to avoid hitting the range limitation of a 64-bit signed long int:
[root:~] # ((n=2**63-1)); echo $n; if [ $n -gt 1 ]; then echo ok; else echo uh-oh; fi
9223372036854775807
ok

[root:~] # (( n++ )); echo $n; if [ $n -gt 1 ]; then echo ok; else echo uh-oh; fi
-9223372036854775808
uh-oh
Another – but very hypothetical – limitation is the 10^10^10 ceiling of bc. Considering the highest integer evaluated by the pros is 2^68, you have nothing to worry about. But, if you have access to the computer from Star Trek’s USS Enterprise (and I am sure it still has Bash available), you may want to consider hypercalc.
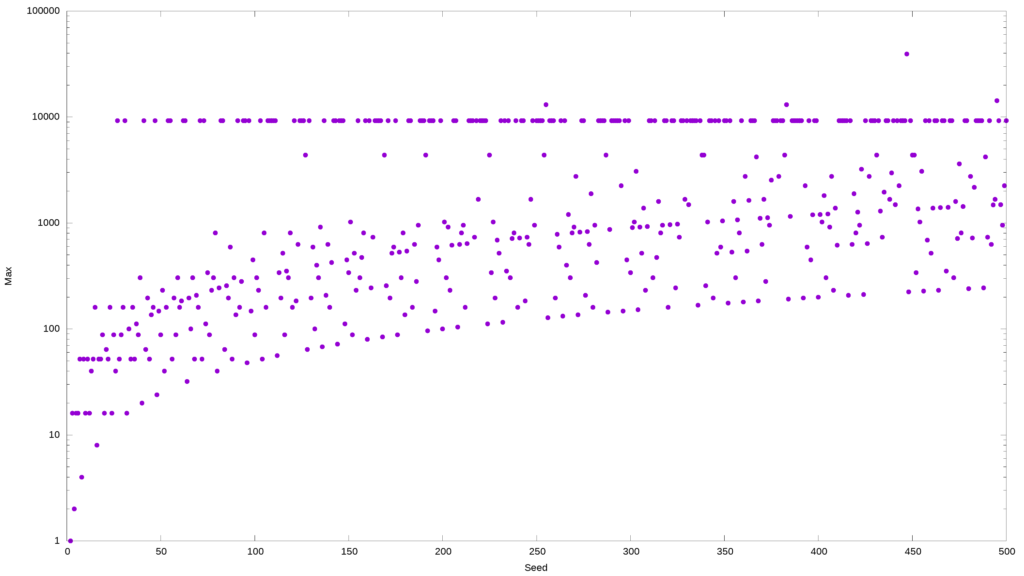
The following command would take a few minutes to go through values between 2 and 500; for each initial integer, it will find the largest value generated by the Collatz algorithm.
# The command below will runs multiple concurrent
# instances of the 3n1 script based on the number
# of CPU cores on your computer. The `sponge`
# command - if you don't have it installed - is
# provided by the more-utils package.

f=$(mktemp) && seq 2 500 | xargs -P$(grep -c proc /proc/cpuinfo) -n1 -I% 3n1 % > ${f}; awk '{if (a[$1] < $3)a[$1]=$3;if (b[$1] < $2)b[$1]=$2}END{for(i in a){print i,b[i],a[i];}}' ${f} | column -t | sponge ${f}
The result will look something like this:
head -10 ${f}

2 1 1
3 7 16
4 2 2
5 5 16
6 8 16
7 16 52
8 3 4
9 19 52
10 6 16
11 14 52
You can then plot this data using Gnuplot:
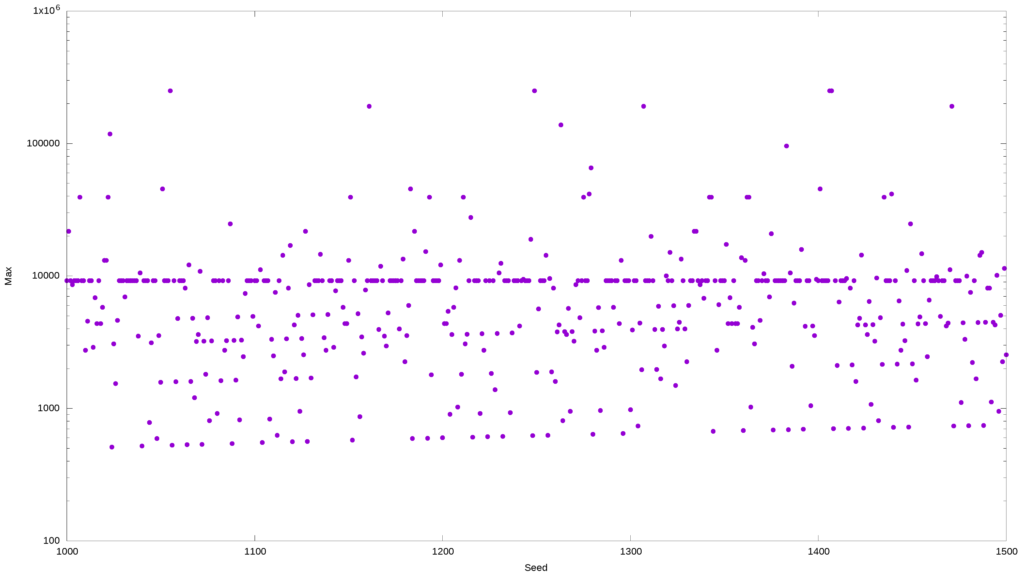
gnuplot -e "set terminal png size 3840,2160 enhanced font '$(find /usr/share/fonts -type f -iname "LiberationSans*Reg*" -print -quit),28'; set output '${f}.png'; set autoscale; set xlabel 'Seed'; set ylabel 'Max'; unset key; set style data labels; set logscale y; plot '${f}' using 1:3:ytic(10) with points pt 7 ps 3"
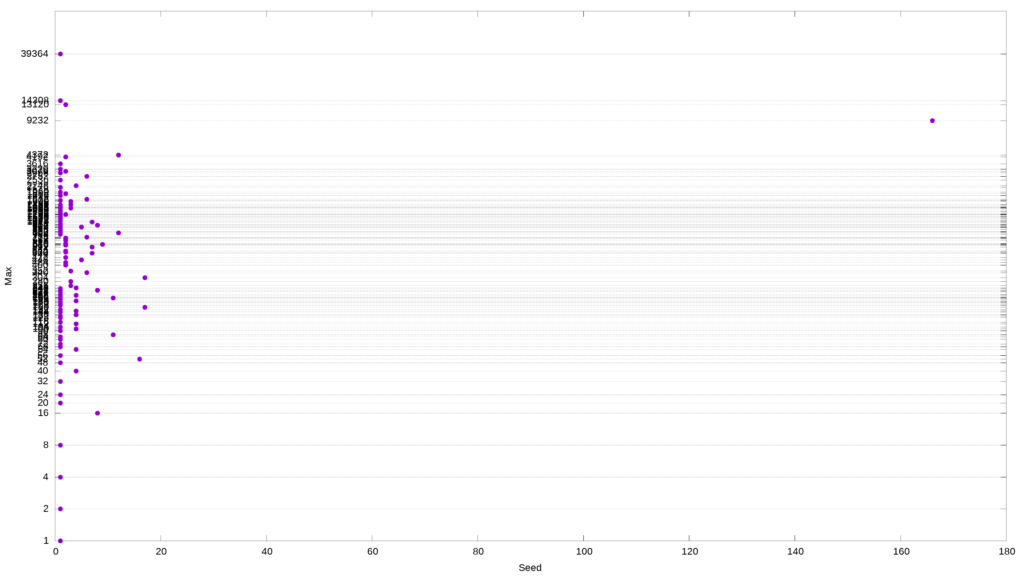
By changing the starting value of n, you will get various interesting patterns. For example, the two samples above have many numbers that hit the same maximum value: 9232.
awk '{print $3}' ${f}  | sort | uniq -c | sort -k1rn | head -10

    166 9232
     17 160
     17 304
     16 52
     12 4372
     12 808
     11 196
     11 88
      9 628
      8 16
9232 is one of the top maximum values; it occurs very frequently and sometimes consecutively. And here’s another odd thing: most starting values that contain 9232 take about 110 interactions to drop to 1. If we test all the starting values from 2 to 10000, we will discover that about 16% will have 9232 as their maximum.
Is there something special about 9232? Apparently, not a damn thing. In fact, the Collatz algorithm produces a great many curious patterns that have tantalized researchers for decades. To us, a pattern is attractive as it suggests the ability to predict the future, which would be the proof we’re seeking.
But think about this: you have a pre-existing pattern (a numerical sequence) that is being algorithmically reworked into another pattern. Hardly unexpected. In fact, most graphical representations of the Collatz conjecture you might’ve seen are based on sequential datasets. But what would happen if, instead of using the 1-500 range, I picked the same number of integers randomly from a vast pool?
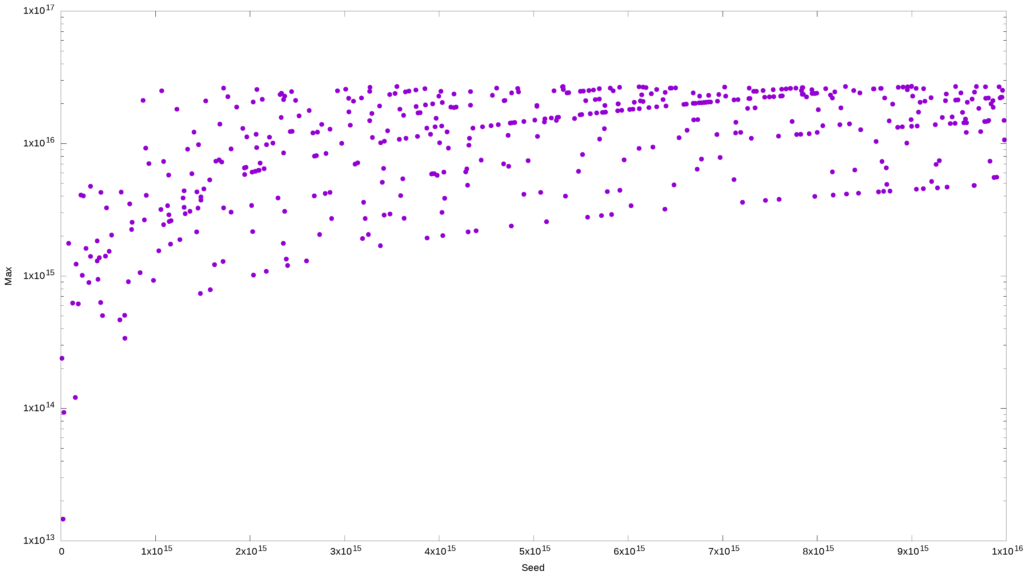
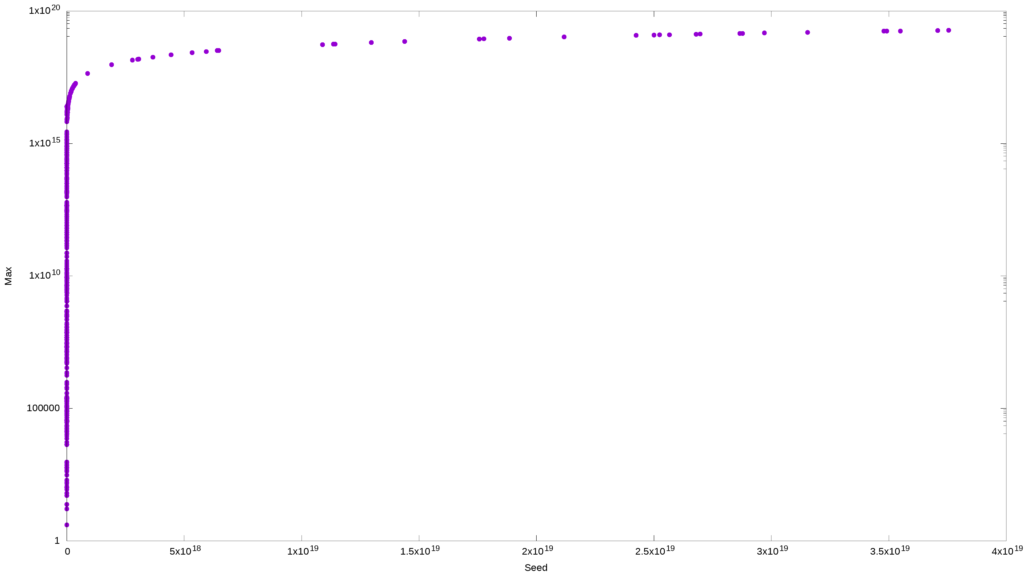
In the example below, I am selecting 500 random numbers between one and ten quadrillions using shuf, and creating a plot of the maximum value as a function of the seed value. I am expecting that visual patterns will be harder to discern.
f=$(mktemp) && shuf -i 1-10000000000000000 -n 500 | xargs -P$(grep -c proc /proc/cpuinfo) -n1 -I% 3n1 % > ${f}; awk '{if (a[$1] < $3)a[$1]=$3;if (b[$1] < $2)b[$1]=$2}END{for(i in a){print i,b[i],a[i];}}' ${f} | column -t | sponge ${f}

gnuplot -e "set terminal png size 3840,2160 enhanced font '$(find /usr/share/fonts -type f -iname "LiberationSans*Reg*" -print -quit),28'; set output '${f}.png'; set autoscale; set xlabel 'Seed'; set ylabel 'Max'; unset key; set style data labels; set logscale y; plot '${f}' using 1:3:ytic(10) with points pt 7 ps 3"
I can still see a pattern here, so maybe shuf was not the best option, or maybe I should have widened the range slightly.
Let s try this again and up the ceiling to a sextillion. This time I will use openssl, od, and shuf – all three are in concert to make the dataset even more randomized. Since we are doing a log plot, I expect to see a representation of a log function. That would tell me that my dataset was sufficiently randomized, and any patterns I thought I saw previously were entirely the product of my imagination.
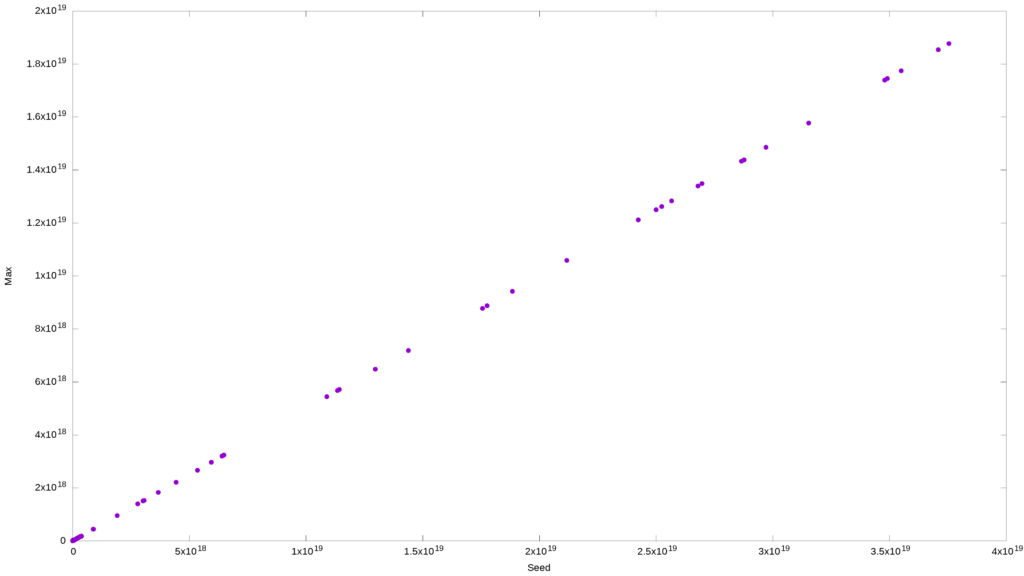
And to be thorough, here’s the same data plotted on the linear scale. And it just shows that the maximum value is proportionally related to the initial value. Also, expected.
What else? Well, we can take a look at these two relationships: the seed value vs. the number of iterations and the maximum value vs. the number of iterations. Because the seed and maximum values are proportionally related, I expect these two graphs to be virtually identical – except for the x-axis scale.
Interestingly, despite the huge ranges, the algorithm takes surprisingly few iterations to bring them all down to 1. What’s also curious is that some huge numbers took a lot fewer iterations to drop to 1 than some much smaller numbers.
Finally, it’s worth noting that both data sets consisting of the random integers generated by openssl, etc. and the hailstone numbers (the values generated by each step of the algorithm on its way down to 1) obey Benford’s law:
f=$(mktemp) && for i in `seq 1 500`; do openssl rand $(shuf -i 1-8 -n 1) | \
od -DAn | tr -d " "; done | xargs -P$(grep -c proc /proc/cpuinfo) -n1-I% 3n1 % > ${f};

pr -w 40 -m -t <(awk '{print $1}' $f | cut -c 1 | sort | uniq -c | sort -rn) \
<(awk '{print $3}' $f | cut -c 1 | sort | uniq -c | sort -rn) | \
(echo -e "SEED . MAX .\nFREQ NUM FREQ NUM" && cat) | column -t

SEED   .    MAX    .
FREQ   NUM  FREQ   NUM
31421  1    35811  1
31342  2    20827  2
27076  3    14338  3
11261  4    12439  4
5669   5    9459   5
3140   6    7436   6
3069   7    6829   7
3019   8    6269   8
2975   9    5564   9
If you plot each hailstone number for a given seed value, the pattern is entirely random, just geometric Brownian motion.
On the other hand, maybe nobody can prove Collatz conjecture because it is wrong, and we should be trying to disprove it instead. You need to find one integer among the infinity that cannot be turned into 1 by the Collatz algorithm – either by growing to infinity or being caught in another loop. Simple brute-forcing is unlikely to work. You would need a more intelligent way to identify potential candidates.
Well, just my two cents. I’m here just for the scripts anyway.

Experienced Unix/Linux System Administrator with 20-year background in Systems Analysis, Problem Resolution and Engineering Application Support in a large distributed Unix and Windows server environment. Strong problem determination skills. Good knowledge of networking, remote diagnostic techniques, firewalls and network security. Extensive experience with engineering application and database servers, high-availability systems, high-performance computing clusters, and process automation.


